Appendix
Every formula, assumption and data source behind the Equipment Health Index, for Q&A. Search on the left. Items taggedFrom Velocity · chat name came from research we ran on Velocity, the Kearney × PERLab research platform; the market numbers and their sources are on the Sources tab.
How we used Velocity
Velocity was our research engine for every number we could not measure ourselves. We ran 20+ Velocity research prompts across a dozen chats and logged each one (prompt, answer, what we used, what we pushed back on) in docs/research/velocity.md.
| Velocity research chat | What it gave us | Where it is used |
|---|---|---|
| Manufacturing Maintenance Data Adoption | CMMS use 45/60/75%, part-level records 5/15/30%, drive/PLC diagnostics availability and use | Install records (~28%) |
| Cabinet Monitor unit economics | Hardware $127/$185/$285, certification, install, data plans, cabinets per plant, comparable monitoring prices | Cabinet Monitor economics |
| Vision feasibility (narrowed rerun) | Label-reading accuracy benchmarks (85%, 94%, >97% OCR), failure modes, design rules, USPAP reliance | Reading labels |
| Common PLC/drive/HMI families + lifecycle | Lifecycle dates checked for the knowledge base (e.g. 1769-L32E discontinued Dec 16, 2020) | Knowledge base |
| Money-thread prompts #1–6, #15–20 | Plant baselines, carrying cost, rush premiums, failure rates by age (#4), emergency vs planned (#5), discount rates (#15), migration labor (#16), sister-plant transfer (#20) | Downtime and CapEx |
| Market validation (3 chats) + 7 deep dives | 83% of automation parts end-of-life in one audit, PLC lead times 10–24 wks, ~1,667 US manufacturing deals, appraisal cost structure | Market |
Where Velocity could not answer (e.g. a national rate of surprise failures, cabinets per plant), we say so and label the number an assumption.
Data collection workflow
| Source | When | What we collect | What it changes in the health score |
|---|---|---|---|
| 1. Label photos | day 1, every cabinet | part number, maker, date code | identity → rated life from the manual, lifecycle status; date code = minimum age |
| 2. Plant records | week 1, where they exist (~28% of parts) | install dates from the CMMS and purchase orders | true age → position on the wear-out curve |
| 3. Cabinet Monitor | continuous, line-stopper cabinets | temperature, motor current, drive fault logs, fan + capacitor life | heat aging; anomalies raise failure risk up to 20×; +30% per fault |
A part uses whatever evidence it has. More sources → tighter remaining-life range and higher confidence (high ±15%, medium ±30%, low ±50%).
Install records: the ~28% formula
How many parts come with a known install date? No survey measures it directly, so we combined the Velocity estimates: From Velocity · Manufacturing Maintenance Data Adoption
P(install record) = P(CMMS) × [ P(part level) × completeness  +  P(machine level) × P(part is original) × completeness ]
                  = 0.60     × [ 0.15 × 0.7                +  0.85 × 0.6 × 0.7 ]
≈ 28% (6% part-level records + 21% machine-level records)| Input | Value (low / base / high) | Basis |
|---|---|---|
| Plant uses a CMMS | 45 / 60 / 75% | Velocity; anchors Plant Engineering surveys 2018 (53%), 2019 (61%) From Velocity · Maintenance Data |
| Of those, part-level records | 5 / 15 / 30% | Velocity, low confidence From Velocity · Maintenance Data |
| Record completeness | 70% | assumption; Lukens et al. 2019 saw cost fields go 20% → 90% after process fixes (via Velocity) |
| Part still original to its machine | 60% | assumption, so a machine install year can date its parts; validate in the pilot |
Also from the same chat: drives exposing fan/capacitor life 10/25/45%; PLCs networked with diagnostics 50/70/85%; plants that routinely use those diagnostics 5/12/25%. That gap (data inside the hardware, unread) is why the Cabinet Monitor reads it.
Reading labels with Claude vision
Each photo is read by Claude (claude-sonnet-5-5) into manufacturer, part number, serial, date code, plus an explicit list of anything unclear. Readings are cached so the demo runs offline.
| Benchmark | Result | Source |
|---|---|---|
| Our test factory: rendered labels incl. glare, blur, worn, cut-off | 127 / 129 exact; the 2 misses flagged unclear, not guessed | measured |
| Building nameplates (Park et al. 2022) | 65.8% → 85.0% character accuracy after post-processing | From Velocity · Vision feasibility |
| Auto-parts part numbers (Schlüter et al.) | 94% | From Velocity · Vision feasibility |
| Control-cabinet detection (Scheck et al. 2026) | > 95% mAP, > 97% OCR | From Velocity · Vision feasibility |
Design rules from that research: an identifier with any ambiguous character is unverified; never silently correct a serial or series letter; low-confidence reads go to a person. Appraisers may rely on AI-collected data but keep responsibility (USPAP Advisory Opinion 41, April 2026). From Velocity · Vision feasibility
Health score formula
Health = 100 × the chance the part survives the next 12 months, from a Weibull proportional-hazards survival model (the reliability-engineering standard).
effective age  a = life_used × rated_life
life_used      = self-reported (fan/capacitor life from the drive)            if available
               = age × heat_factor / rated_life                               otherwise
heat_factor    = 2 ^ ((T − T_ref) / 10)      (life halves per +10 °C; half of today's excess counted for the past)
hazard mult. m = exp( ln(20) × anomaly_severity ) × (1 + 0.3 × faults_12m)     (faults capped at 5)
η = 1.1 × rated_life,  β = 3

health        = 100 × exp( −m × ((a + 1)^β − a^β) / η^β )          floored at 1
remaining life = (a^β + η^β × ln 2 / m)^(1/β) − a                    (conditional median)
range = ± 15% / 30% / 50% for high / medium / low confidence| Status | Rule |
|---|---|
| Replace ASAP | health ≤ 10, or getting a replacement takes longer than the life left |
| Replace soon | ≥ 75% of life used, but there is still time to get one |
| Working | otherwise |
Rated life comes from the manufacturer manual / knowledge base. T_ref: drives 55 °C, PLCs/HMIs 45 °C, power supplies 50 °C. Order-by dates use the health model's conservative remaining life (below).
Anomaly detection statistics
Each monitored part learns its own normal over 30 days, then every daily summary is checked by standard statistical process control:
expected temp:  (T − ambient) = a + c × load        (least squares on the 30-day baseline)
residual r      = actual − expected
EWMA            z_t = 0.2 r_t + 0.8 z_{t−1};  alarm beyond 3σ limits        → sudden shifts (failing fan)
CUSUM           S_t = max(0, S_{t−1} + r_t/σ − 0.5);  alarm at S > 5        → slow drift (aging capacitors)
trend           slope of r over time, t-test;  alarm at > 1 °C/month, t > 3 → warming
peers           robust z vs same-model parts (median / MAD);  alarm at |z| > 3
motor current   Mahalanobis distance on RMS/load + sideband energy;  alarm at > 3
severity        1 − exp(−(stat − alarm)/alarm) per detector;  anomaly_severity = max (0–1)
judged on the last 7 days
Toledo line-stopper drive with a failing fan (planted, simulated sensor data): EWMA crosses its limit the week the step starts. Measured false-alarm rate: ~1 in 40 monitored parts.
Downtime avoided and output protected
Downtime is the number plants feel. We count it two ways, and only for spare rescues we actually found (a line-stopping part whose spare sits at a sister plant). Never scaled up to the whole plant, never in the fee.
hours down without spare = min(lead time to buy one, outage cap 10–25 operating days) × operating hours/day
hours down with spare    = transfer (1–2 days) + swap (2–8 h)
at stake (one failure)   = (hours without − hours with) × line $/hour × share of output never made up (40–80%)

OUTPUT PROTECTED   = Σ at stake                                  (Toledo: $622k, 668 h of stoppage)
DOWNTIME AVOIDED   = Σ P(fails within 3 yrs) × at stake, discounted at 10%, per year   (Toledo: ~$77k/yr, $12–205k)
EXPOSURE / YEAR    = P(fail this year) × hours down × $/hour × unrecovered share        (line-stopper table)

P(fail this year)  = 1 − health/100     (the part's own health score: age, heat, sensor anomalies, faults)
                   = age table below     (only for parts with no health evidence)
Fallback failure odds by age, for parts with no health score: 0–10 yrs 2–5%/yr, 10–20 yrs 4–8%, 20+ yrs 6–10% From Velocity · money thread #4. Transfer time and cost From Velocity · #20 sister-plant transfer. Line $/hour from plant revenue and operating hours From Velocity · #1 plant baseline.
CapEx cliff and order-by dates
CapEx in year Y   = Σ replacement cost of control parts expected to reach end of life in Y  (+ migration engineering if discontinued)
replacement cost  = market price from trusted listings, else type fallback;  migration = engineering hours × integrator rate
failure date      = today + health model's conservative remaining life   (else install year + typical life)
order-by          = failure date − lead time − 14-day buffer
Component prices and migration labor From Velocity · #16 prices + migration labor; emergency vs planned cost From Velocity · #5; lead times for new PLCs 10–24 wks From Velocity · market validation.
Sourcing and where to buy
Recommended order: a spare already on a shelf in the portfolio (reserve it, ~7 days) → the manufacturer or an authorized distributor (for discontinued parts: the official successor) → refurbishers and marketplaces, flagged as counterfeit risk.
Marketplace prices: 42 real listings hand-collected for the demo parts, plus real distributor offers. Lifecycle status comes from manufacturer pages and distributor records (source URL + date on every knowledge-base row). From Velocity · PLC/drive/HMI lifecycle check
Cabinet Monitor: design and economics
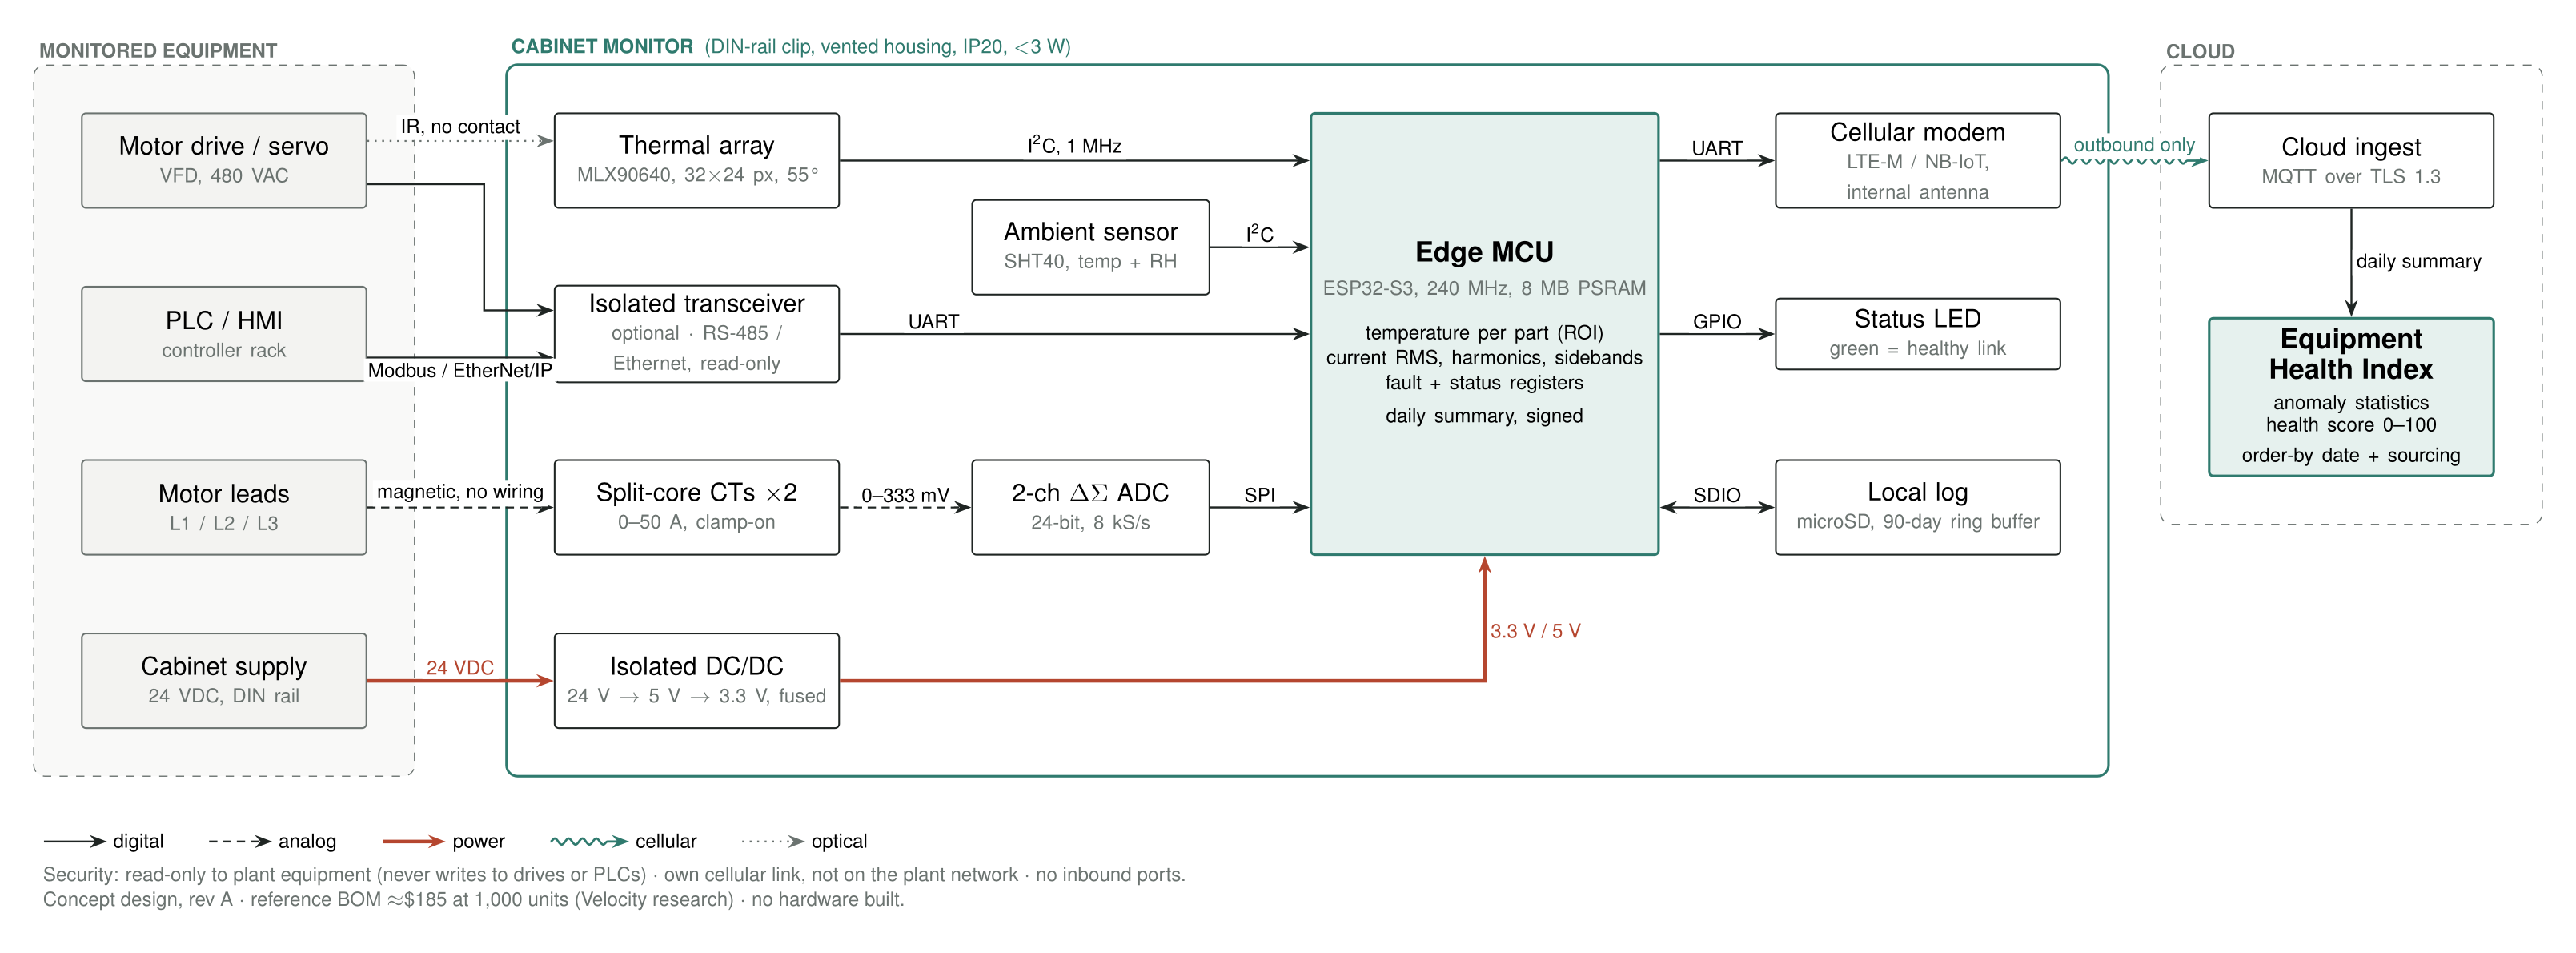
| Item | Low / base / high | Basis |
|---|---|---|
| Hardware at 1,000 units | $127 / $185 / $285 | MLX90640 ~$31 (Octopart), ESP32-S3 $3.73, SHT40 $1.33 (DigiKey), 24→5 V ~$20 From Velocity · Cabinet Monitor unit economics |
| Certification (one time) | $25k / $55k / $100k | safety listing + FCC (pre-certified module $4.9–10k) + cellular From Velocity · unit economics |
| Install per cabinet | $120 / $250 / $520 | 1.5–4 h × loaded electrician rate (PILARS 2026) From Velocity · unit economics |
| Data + cloud per year | $10 / $30 / $90 | 1NCE, Hologram, AWS IoT Core From Velocity · unit economics |
| All-in first year per cabinet | ~$270 / ~$474 / ~$902 | From Velocity · unit economics |
| Line-stopper cabinets per plant | 20 / 60 / 150 | planning assumption, no published benchmark From Velocity · unit economics |
| Comparable monitoring | $300 / $900 / $2,400 per asset-year | Erbessd $22/device/month + $400; Augury unpublished From Velocity · unit economics |
Read-only to plant equipment, own cellular link (not on the plant network), no inbound ports. Before quoting: qualify the clamps, confirm camera field of view in a real cabinet, test LTE-M inside a closed steel cabinet. Diagram source: docs/plan/hardware/cabinet-monitor-diagram.tex (TikZ).
How we charge, savings and revenue
We charge for what the customer can count, not for what we say they saved. Never a share of savings: savings can't be audited, so a share of them would make us the judge of our own fee (mentor feedback).
| Step | Price | What it covers |
|---|---|---|
| 1 · One-time: onboard a plant | $1–2k flat, per plant | first scan: registry, line stoppers, spending by year |
| 2 · Yearly: registry subscription | $4–10k per plant, tiered by the number of critical parts | kept current: lifecycle alerts, rescans, spares on every plant's shelf |
| 3 · Monthly: sensors | $ per monitored point (price to set) | clip-on Cabinet Monitors on the riskiest parts, hardware included |
Toledo pays ~$9.7k a year against ~$48.6k of auditable savings: paid back in ~2.4 months. Cost to serve a plant: $0.3–1.8k a year. Tier amounts come from Brandon's money model (xray/pricing.py); pilots test willingness to pay.
| Direct savings at Toledo (slide 8) | Per year | How |
|---|---|---|
| Spares carrying cost | $16.6k | excess spares × carrying cost % From Velocity · money thread #2 |
| Planned instead of emergency buys | $13.7k | at-risk parts × P(fail) × (emergency − planned price) From Velocity · #5 |
| Purchases a sister plant's spare avoids | $10.5k | P(fail) × (part value − transfer cost) From Velocity · #20 |
| Rush premiums | $7.8k | rush premiums × share avoided From Velocity · #3 |
| Total, auditable | $48.6k | each line traced to parts in the registry; whole-plant extrapolation by coverage |
| Idle spares cash, freed once | $79k | excess spares inventory released (one-time, not priced) |
Revenue per PE portfolio (slide 9: $1–4M a year). A typical mid-market PE portfolio: 10–20 companies, 30–100 plants.
registry      = plants × ~$5.9k (demo-plant average)                       = $0.2–0.6M / yr
sensors       = plants × ~60 line-stopper cabinets × $50 / point / month     = $36k per plant / yr   (illustrative; price to set)
total         = 30 plants × ($5.9k + $36k) ≈ $1.3M   …   100 plants ≈ $4.2M   → $1–4M / yr
market        = 25,800 US plants with 100+ employees (Census CBP 2022): registry alone $7.6M / yr at 5%, $152M at all
The $50 / point / month sensor price is an assumption for illustration (comparable monitoring sells for ~$900 per machine per year From Velocity · unit economics). Without sensors one portfolio is ~$0.2–0.6M a year.
The savings model stays as the customer's business case (payback), not as the price formula. Comparable monitoring sells for ~$900 per machine per year From Velocity · unit economics.
Proof: what we measured
| What | Result | How |
|---|---|---|
| Part numbers read from label photos | 127 / 129 exact; 2 misses flagged | synthetic test factory with planted answers |
| Matching parts to the catalog | 100% precision, 98% recall | against the answer key |
| Planted failures caught by the health model | 5 / 5 score ≤ 40 | failing fan, worn capacitors, current anomaly, hot connection, overheating relay |
| False alarms (anomaly detectors) | ~1 in 40 monitored parts | parts with no planted problem |
Sensor data in the demo is simulated in the exact format the device would send; plants are fictional; part numbers, lifecycle data and listings are real.
The $1.4T on the problem slide
What it is: unplanned downtime costs the world's 500 largest companies about $1.4 trillion a year, 11% of their revenue (Siemens, The True Cost of Downtime, 2024). From Velocity · Manufacturing Equipment Risk Costs
How to say it: it is a cost to the largest companies, not the size of a market, and not specific to mid-market plants. For smaller firms, the same Velocity research found 52% of smaller US manufacturers put an hour of downtime at $50k or more, and 44% have an equipment interruption every month.
How much automation is end-of-life (83%)
What it is: one real plant audit published by Siemens (2025): 699 of 843 automation assets, from 17 manufacturers, were discontinued or end-of-life. From Velocity · Manufacturing Equipment Risk Costs
Why we don't headline it: it is one plant, from a vendor that sells upgrades, not a national rate. Siemens' other published audits found 35% (3,686 filling/packaging assets), 59% (914 process assets) and 60% (388 utility assets). From Velocity · Manufacturing Equipment Risk Costs
What we claim: a large share of the automation in older plants is past its supported life, often a third to most of it. Our own demo portfolio, built on real part numbers and lifecycle data, has 32% of critical parts discontinued or end-of-life. No survey measures a national rate, so we never quote one.
Market, competition, risks
| Market | Number | Source |
|---|---|---|
| US multi-plant manufacturers (recurring accounts) | 8–18k | Sources tab |
| PE-owned manufacturers in hold | 2–4k | Sources tab |
| US manufacturing deals (2024) | 1,667; ~670 with an equipment review | From Velocity · deal volume deep dive |
| Automation parts end-of-life in one plant audit | 83% | From Velocity · Manufacturing Equipment Risk Costs |
| New controller lead time | 10–24 weeks | From Velocity · Installed-Base Audits Market |
| Competitor | Gap |
|---|---|
| Appraisers | value machines, not parts |
| Operations diligence | one-time, not kept up |
| Controls audits (e.g. OEM installed-base audits) | one brand at a time |
| Monitoring vendors | ~$900 per machine per year, no part registry |
| Risk | How we would know |
|---|---|
| Plants have terrible data | pilot plant coverage: share of parts with an identity, a date and a health score |
| The health score is unproven | calibrate on 10 cabinets for 90 days against real failures |
| Plants won't install hardware | install time and approvals in the pilot (read-only, clamp-on, planned stop) |
Every assumption
| Assumption | Value | Justification |
|---|---|---|
| Parts with an install record | ~28% | 60% CMMS × (15% part-level × 70% complete + 85% machine-level × 60% original × 70%); Velocity research, Plant Engineering surveysFrom Velocity · see section 01 |
| Record completeness | 70% | assumption; a measured CMMS study saw record fields go from 20% to 90% filled (Lukens 2019) |
| Part still original to its machine | 60% | assumption, so a machine install year can date its parts; validate in the pilot |
| Heat aging | life halves per +10 °C | Arrhenius rule of thumb in capacitor and fan datasheets |
| Design-point temperature | drives 55 °C, PLCs 45 °C | typical rating points for industrial electronics; verify per manual |
| Past heat history | half of today's extra heat | we only see today's temperature, not the part's past |
| Health score | 100 × P(survives next 12 months) | Weibull survival model (reliability-engineering standard); shape 3 = wear-out; scale 1.1 × rated life from the manual |
| Anomaly alarms | EWMA 3σ, CUSUM h = 5, z > 3, Mahalanobis > 3 | standard statistical process control defaults; measured ~1 false alarm per 40 monitored parts |
| Anomaly effect | failure rate × up to 20 | proportional hazards: severity 0–1 scales the hazard; assumption, calibrate against real failures in the pilot |
| Fault effect | +30% failure rate per fault (max 5) | assumption; faults logged by the drive in the last 12 months |
| Remaining life | conditional median | years until P(survive | survived so far) = 50%, from the same Weibull model |
| Remaining-life range | ±15% / 30% / 50% | by confidence (high / medium / low), set by which evidence exists |
| Device hardware cost | $185 ($127–285) at 1,000 units | Velocity research: MLX90640 ~$31 (Octopart), ESP32-S3 $3.73 (DigiKey), SHT40 $1.33, 24→5 V supply ~$20; current clamps are the big unknownFrom Velocity · see section 01 |
| Install per cabinet | 2.5 h × $100 = $250 ($120–520) | Velocity research; loaded electrician rates (PILARS 2026); done in a planned stopFrom Velocity · see section 01 |
| Data + cloud | $30 / device / yr ($10–90) | Velocity research; 1NCE $14 for 10 yrs / 500 MB, Hologram $1/SIM/month, AWS IoT CoreFrom Velocity · see section 01 |
| Certification, one time | $55k ($25–100k) | Velocity research; safety listing + FCC (pre-certified module, $4.9–10k quotes) + cellular; spread over the rolloutFrom Velocity · see section 01 |
| Line-stopper cabinets per plant | 60 (20–150) | Velocity research estimate; no published cabinets-per-plant benchmark, so a planning assumptionFrom Velocity · see section 01 |
| Comparable monitoring price | ~$900 / machine / yr ($300–2,400) | Velocity research; e.g. Erbessd $22/device/month + $400 hardware; Augury doesn't publish pricesFrom Velocity · see section 01 |
| Failure odds used in the dollars | 1 − health/100 per year | the part's own health score (age, heat, anomalies, faults); the age table (2–10%/yr, Velocity #4) only for parts with no health evidenceFrom Velocity · see section 01 |
| Replace ASAP threshold | health ≤ 10 | under ~10% chance of surviving the year, or a replacement takes longer than the life left |
| Health floor | 1 (never 0) | the model can say 'almost certain to fail', not 'certain' |
| Registry subscription | $4–10k / plant / yr | fixed fee tiered by the number of critical parts; amounts from Brandon's money model; never a share of savings |
| Onboarding | $1–2k per plant, once | first scan: registry, line stoppers, spending by year |
| Sensor price | $50 / point / month (illustrative) | price to set; used only for the $1–4M portfolio example; comparable monitoring ~$900 / machine / yr (Velocity)From Velocity · see section 01 |
| Typical PE portfolio | 10–20 companies, 30–100 plants | planning assumption for a mid-market industrial fund |
| Downtime horizon | one failure per spare, 3 years, 10% discount | conservative; outage capped at 10–25 operating days, 40–80% of lost output never made up |
| Sensor data in the demo | simulated | no hardware built; data is in the exact format the device would send |